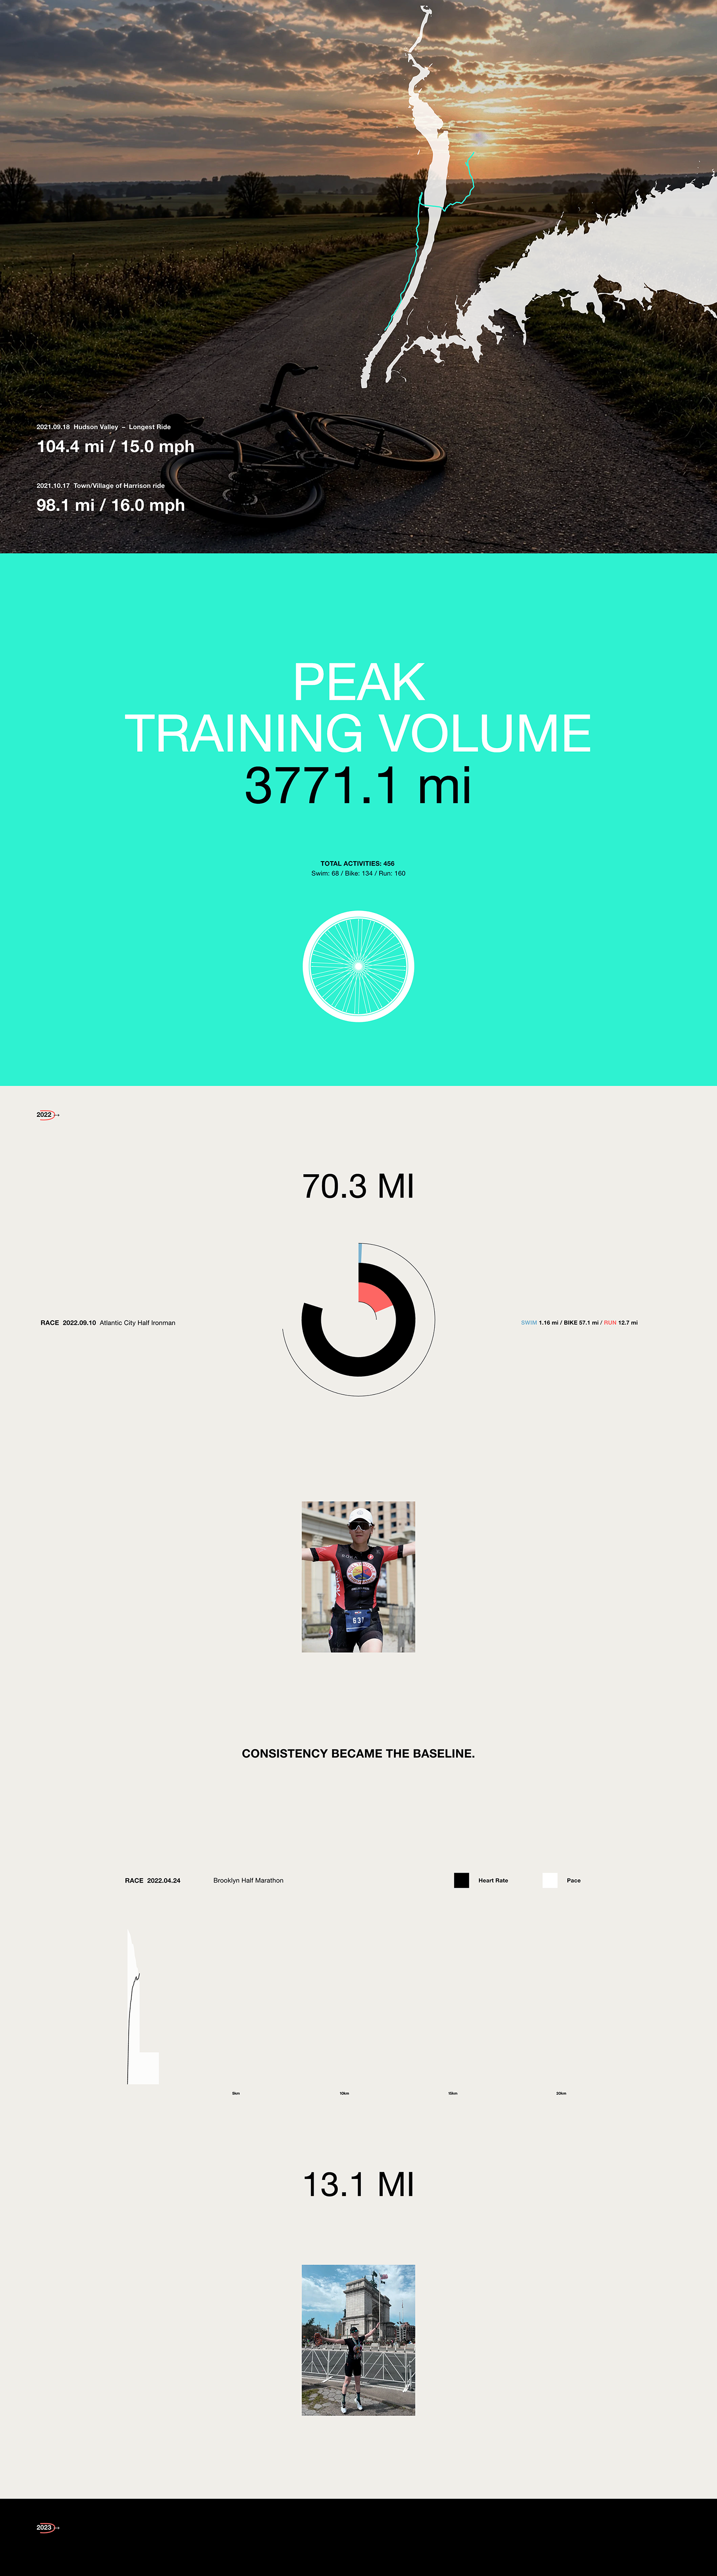
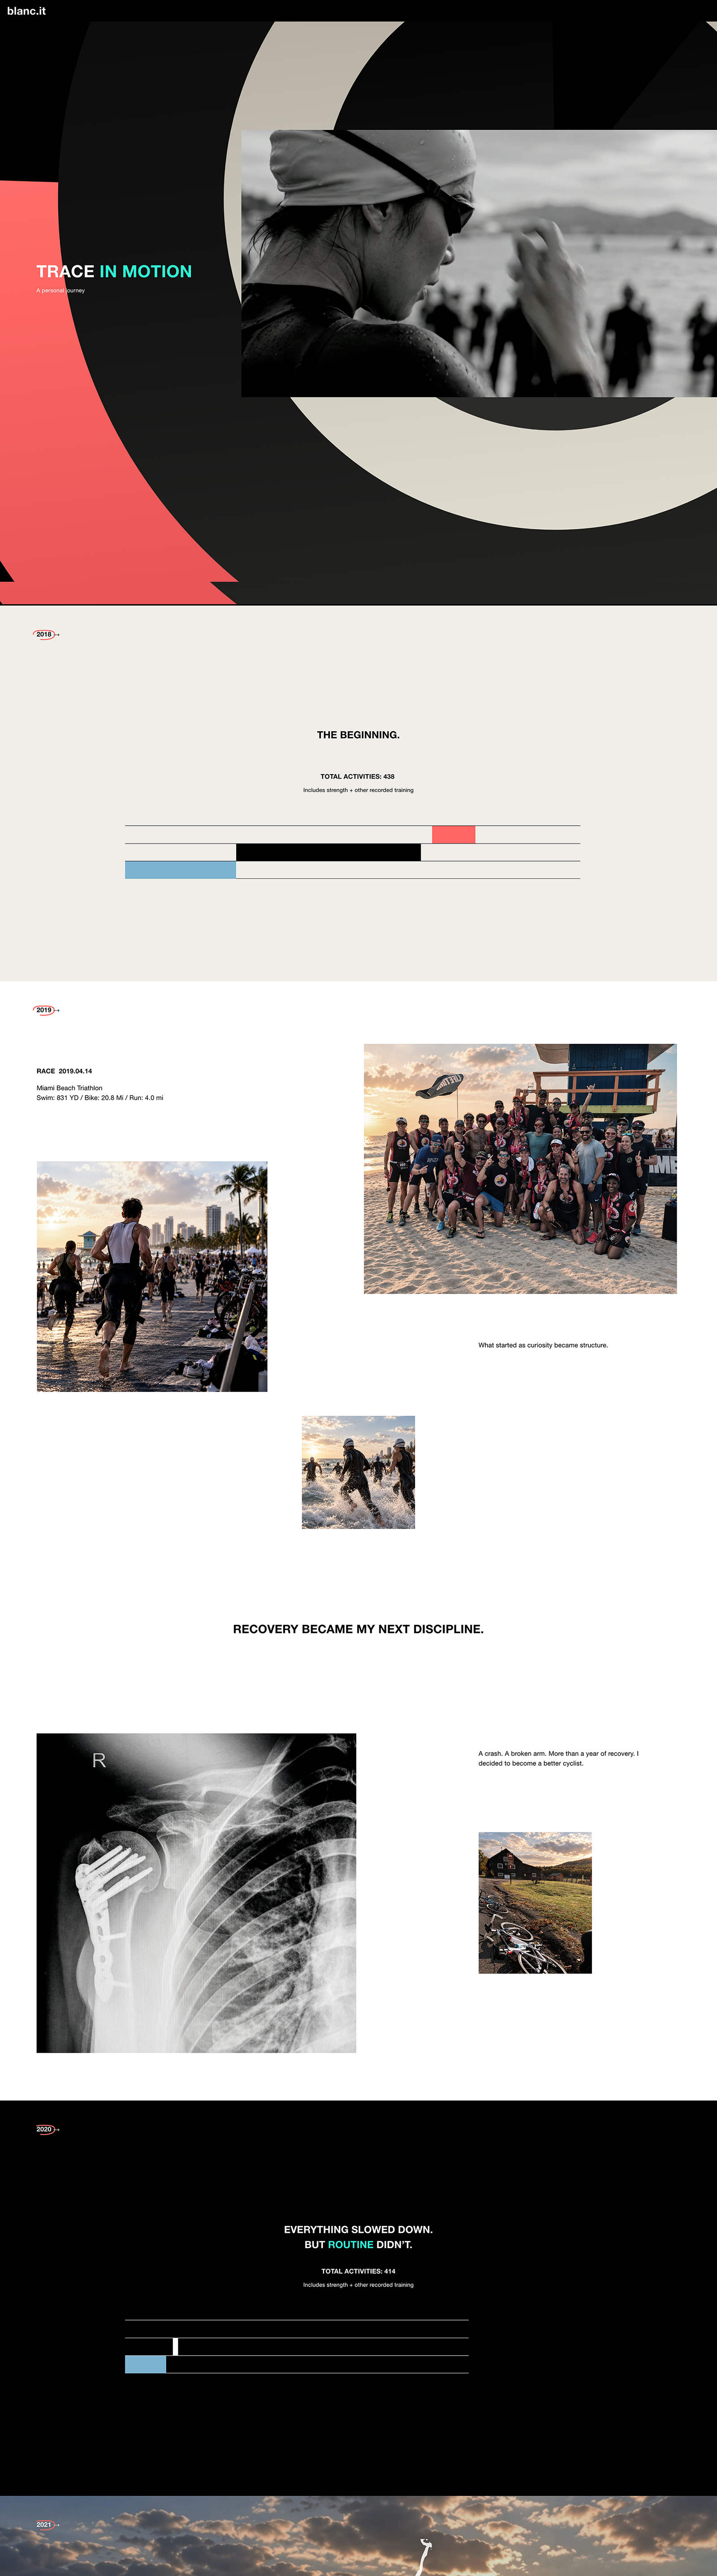
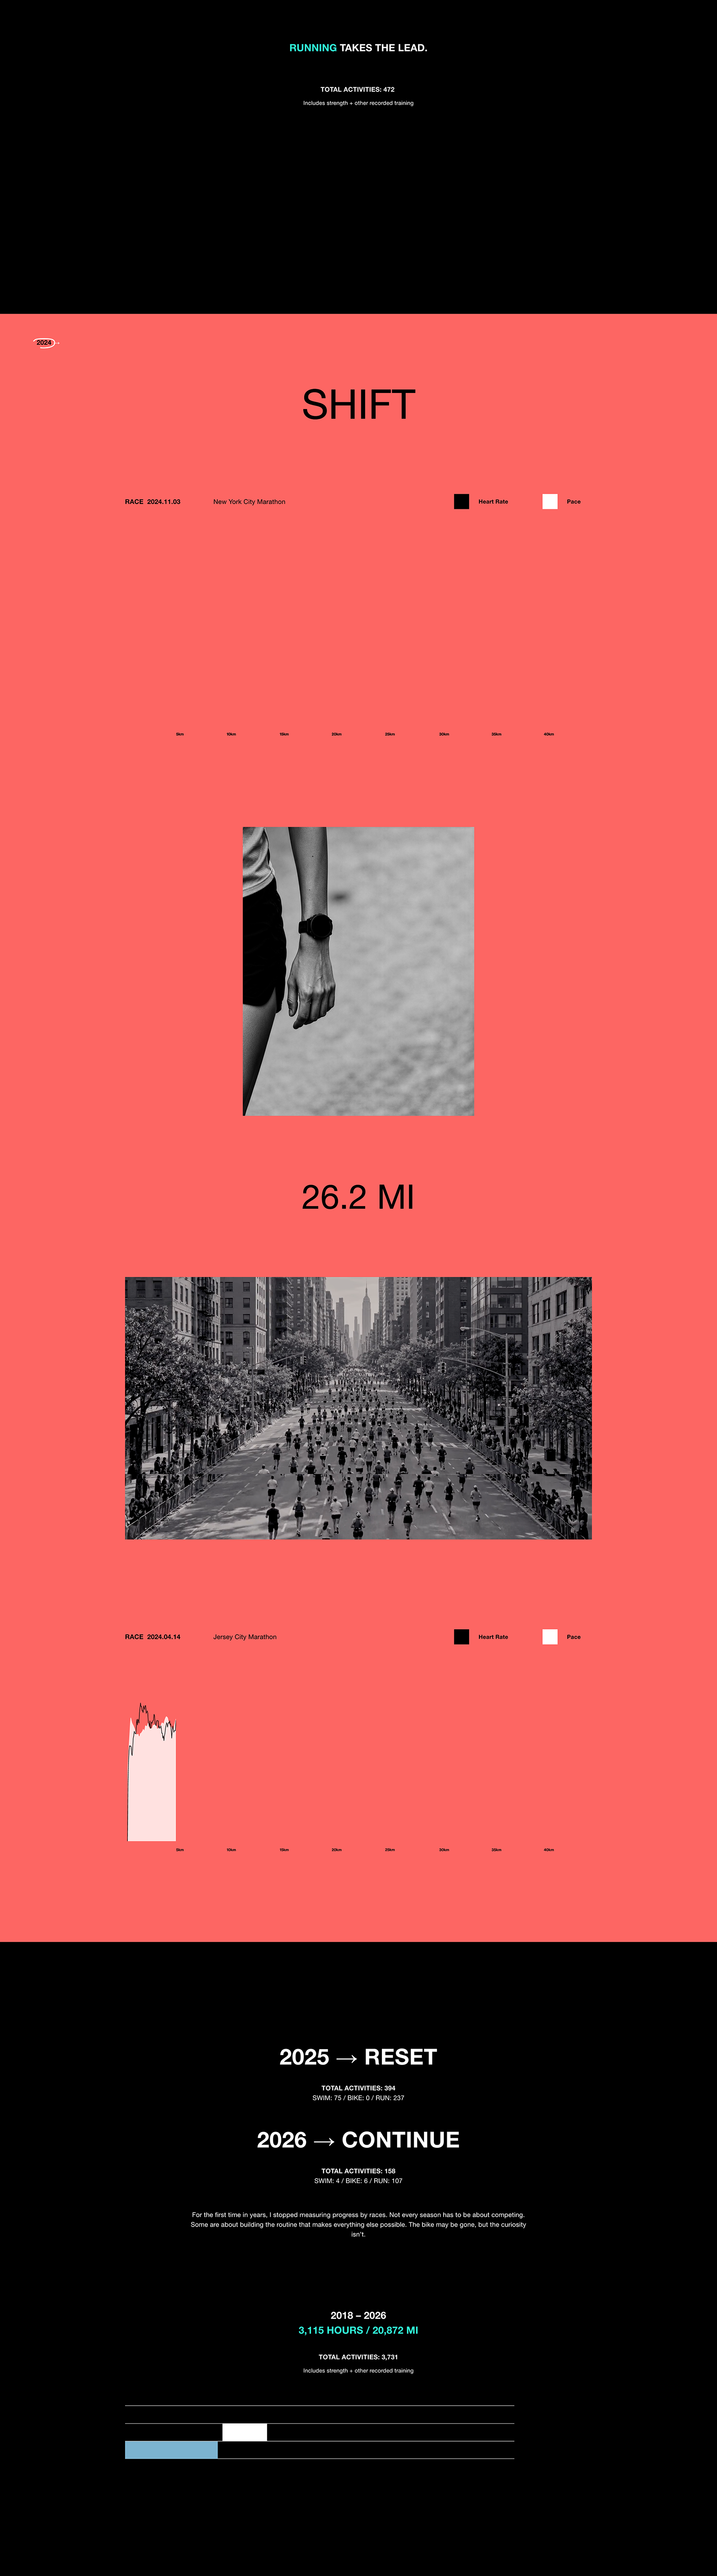
TRACE IN MOTION
I had eight years of training data sitting in a single export file: 3,731 activities, 3,115 hours, and 20,872 miles.
The project began as a just-for-fun side project. I used the data as both the content and the creative framework, transforming a raw CSV into a published site. The story unfolds year by year through activity totals, race splits, elevation, heart rate, and pace.
Role: Creative Direction, design, data, motion, imagery, build
Year: 2026
Design: Illustrator, Figma, Squarespace
Imagery and video: ChatGPT, Kling AI, Photoshop, Premiere Pro
Code: SVG and CSS, written with Claude. Hosted on GitHub
Process: Charts
I designed the charts in Illustrator and exported them as SVGs. Claude wrote the code, while I directed the timing, sequencing, and easing. Each chart adapts to desktop and mobile layouts.
GRAPH 1: The wide chart is redrawn for narrow screens, not scaled down. Rows and labels stay the size they were designed at.
Desktop
Mobile
GRAPH 2: Four stacked shapes were rebuilt as individual SVG arcs, allowing each band to animate independently from the same starting edge.
As exported
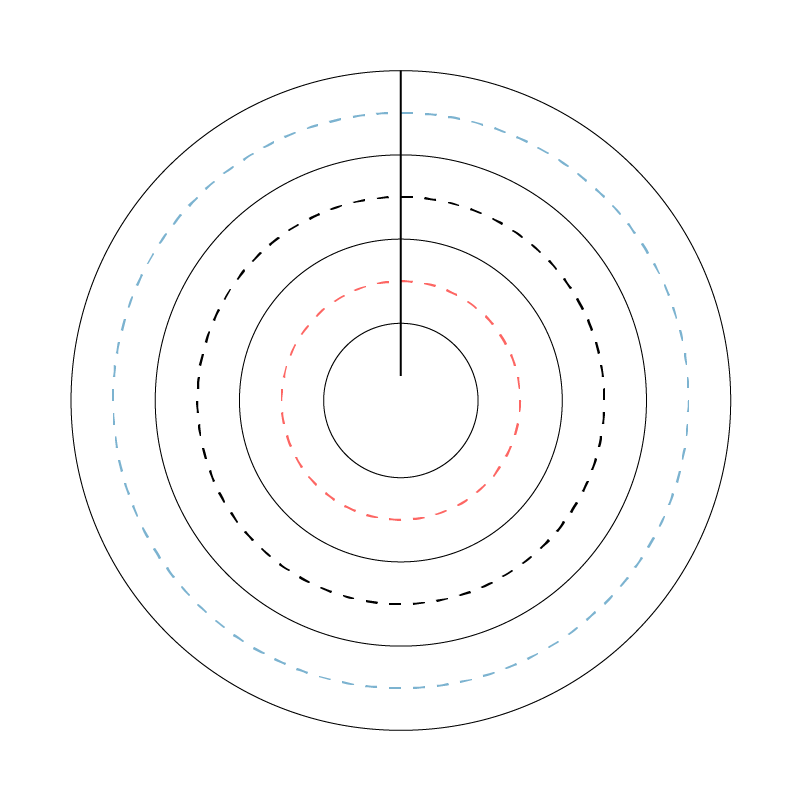
The construction:
Dashed = center radius, stroked at the band's own width

Opening
GRAPH 3: Two independent series on one canvas. Pace sampled every 50 metres, heart rate over the same distance.
GRAPH 4: A route drawn from 685 GPS points is revealed in one continuous motion, starting quickly and slowing toward the finish. Four frames show the progression.
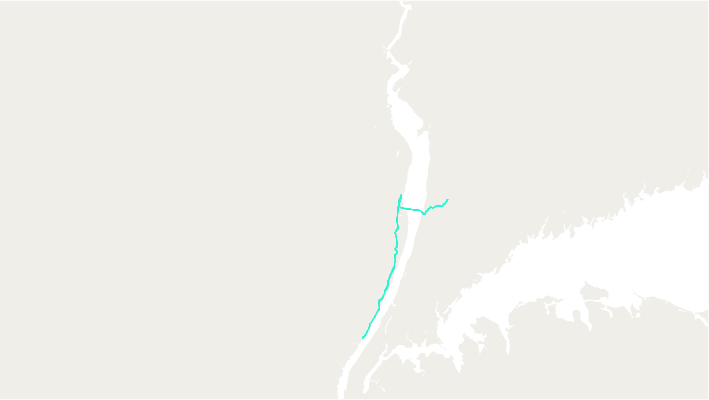
25%
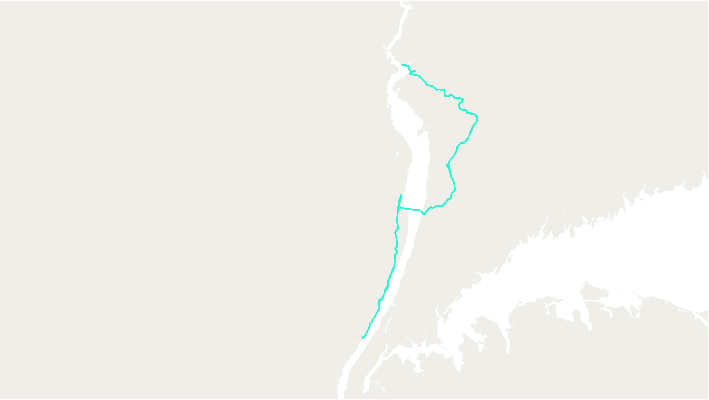
50%
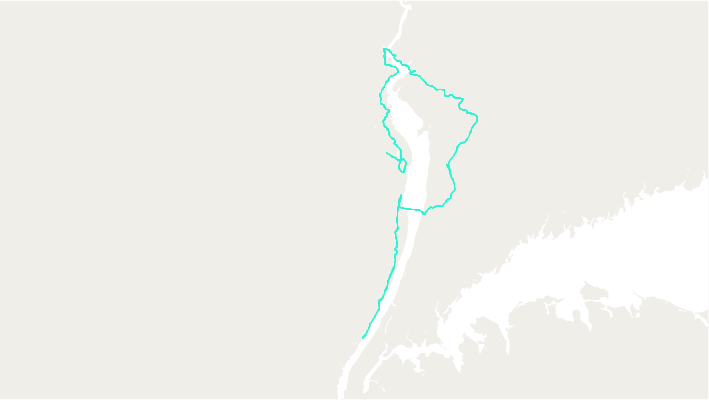
75%
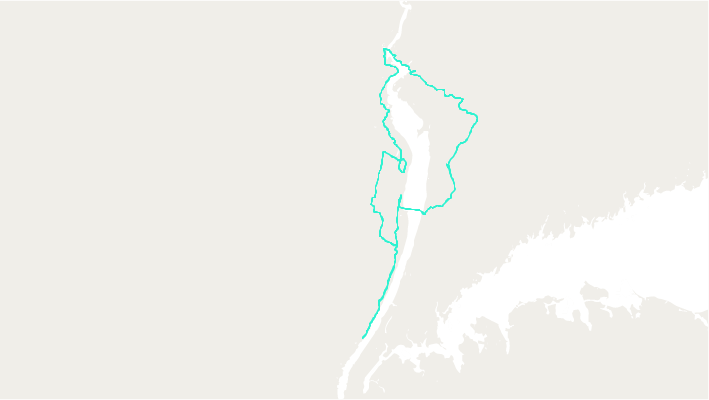
100%
GRAPH 5: The wheel speeds up and slows down through a custom motion curve, creating a varied rhythm within a seamless six-second loop.

Angular speed

One marked spoke, sampled every half second
Process: Images and Videos
I set the visual direction and photographic style before generating the images in ChatGPT. I then animated them in Kling, upscaled the clips in Runway, and edited and finished the video in Premiere. No footage was shot.
CREATIVE DIRECTION: Before generating any imagery, I established a consistent visual language: black-and-white documentary sports photography, natural daylight, deep blacks, textured midtones and restrained film grain. Faces remain secondary to movement, equipment and physical effort.
REFERENCES
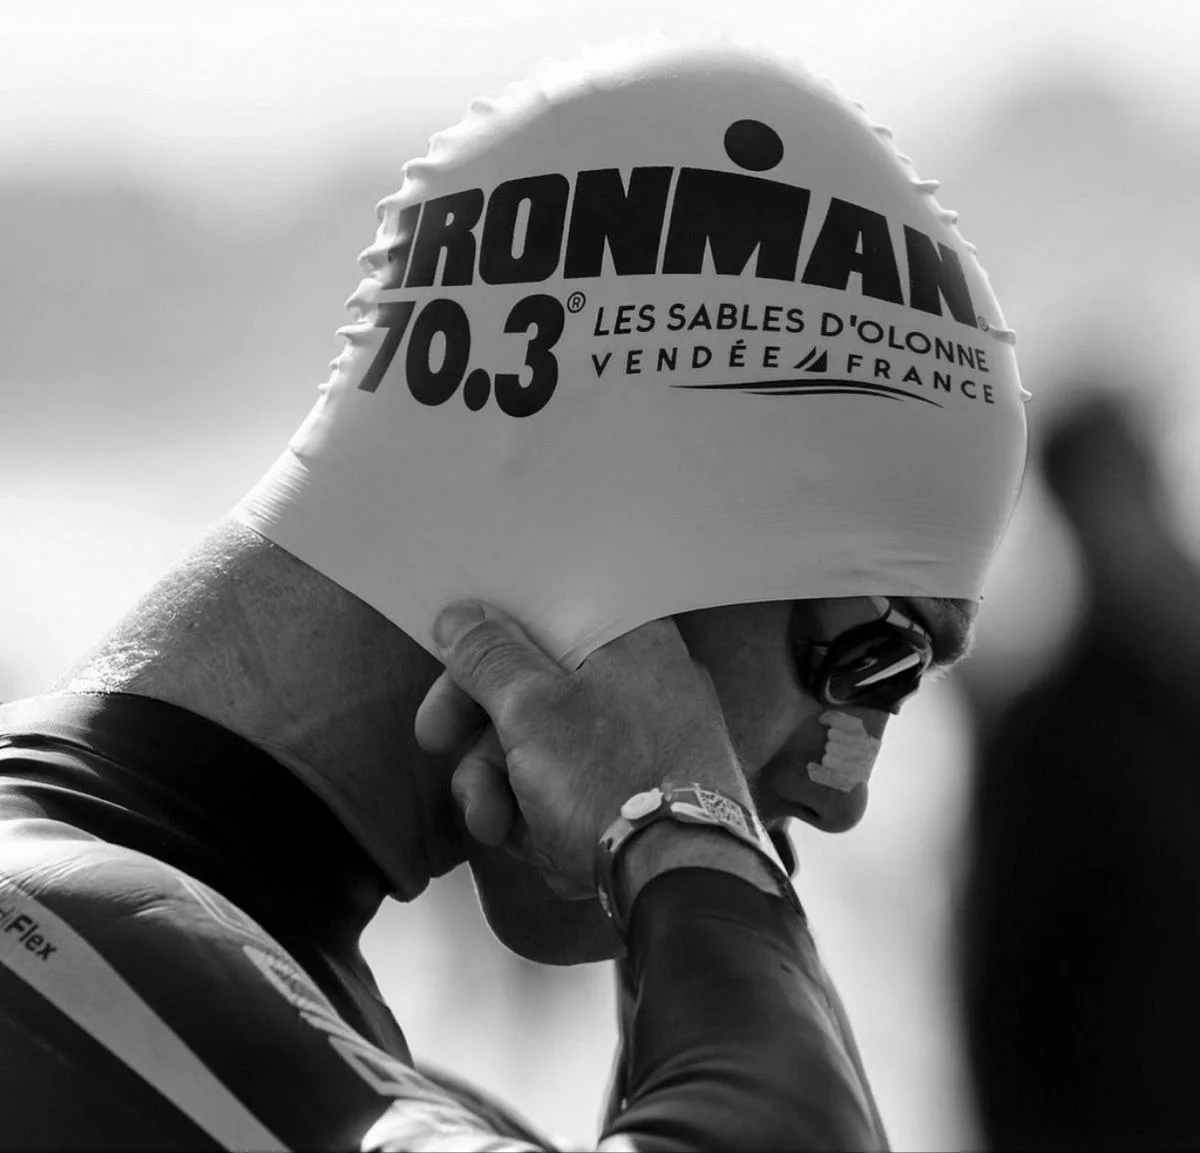
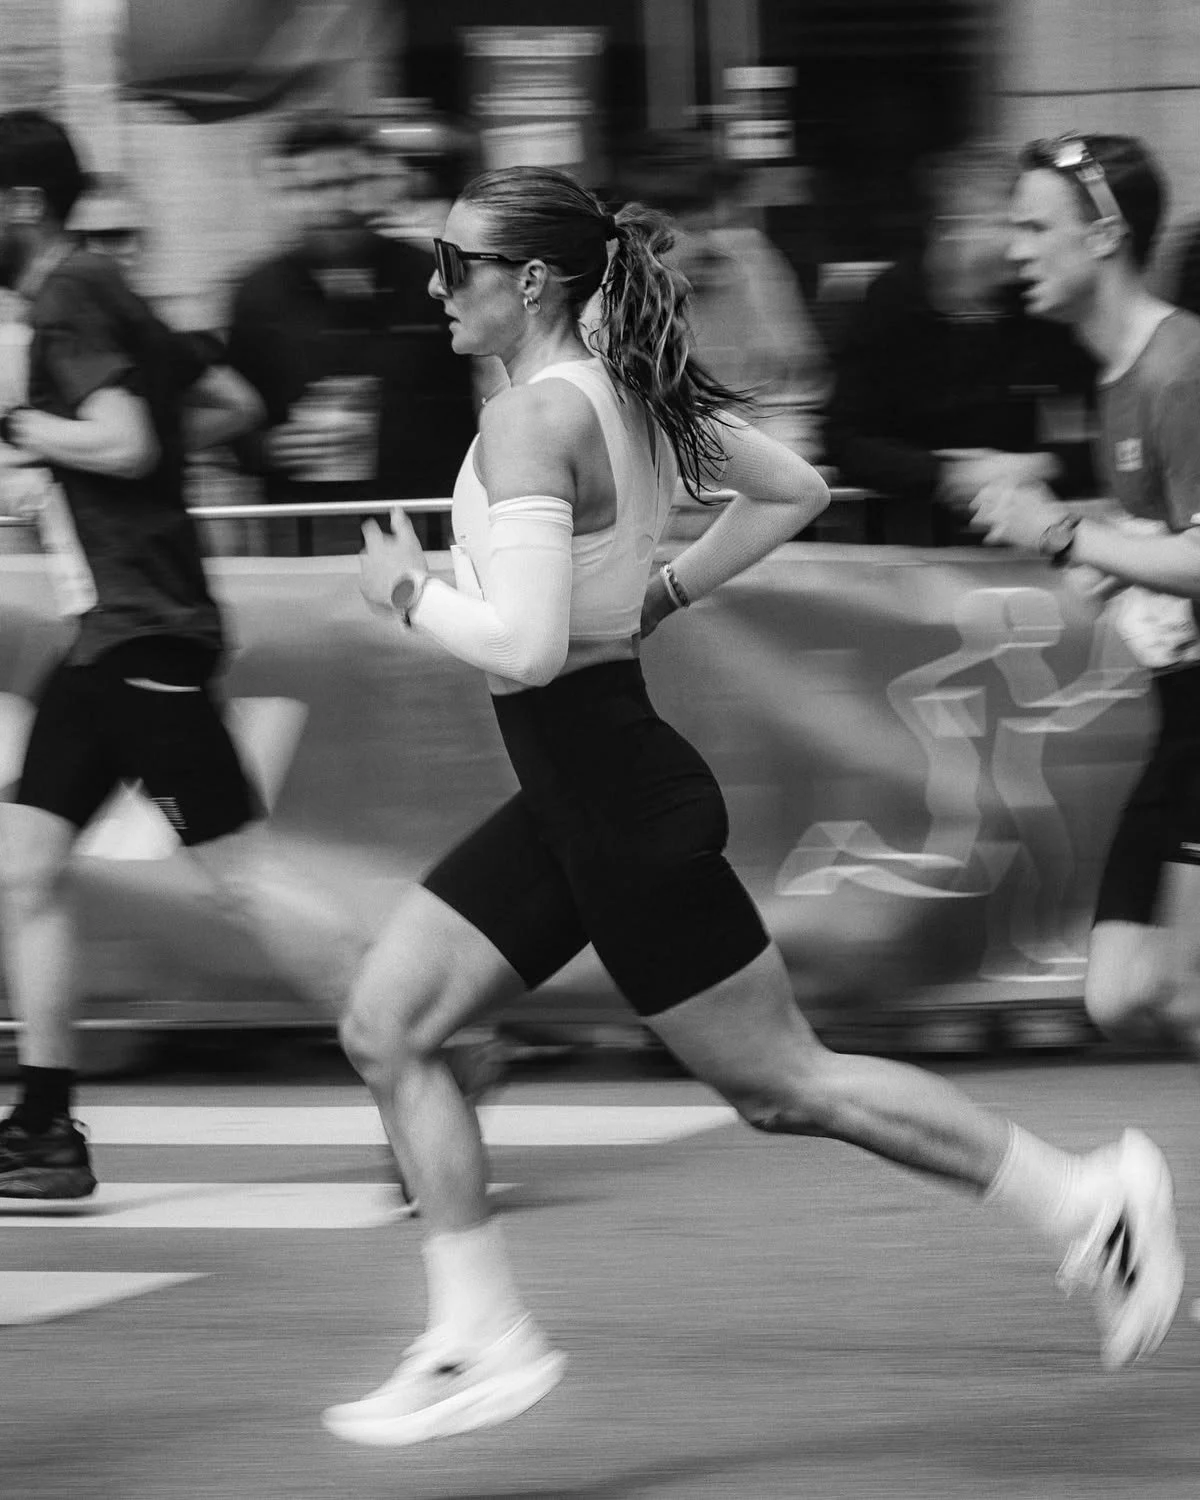
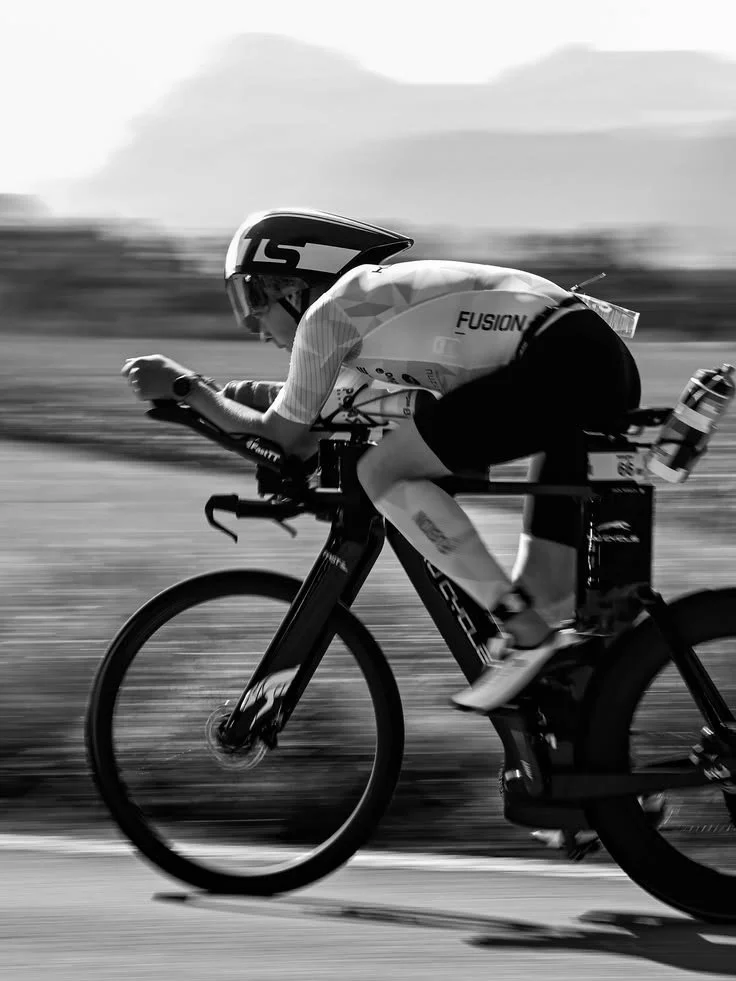
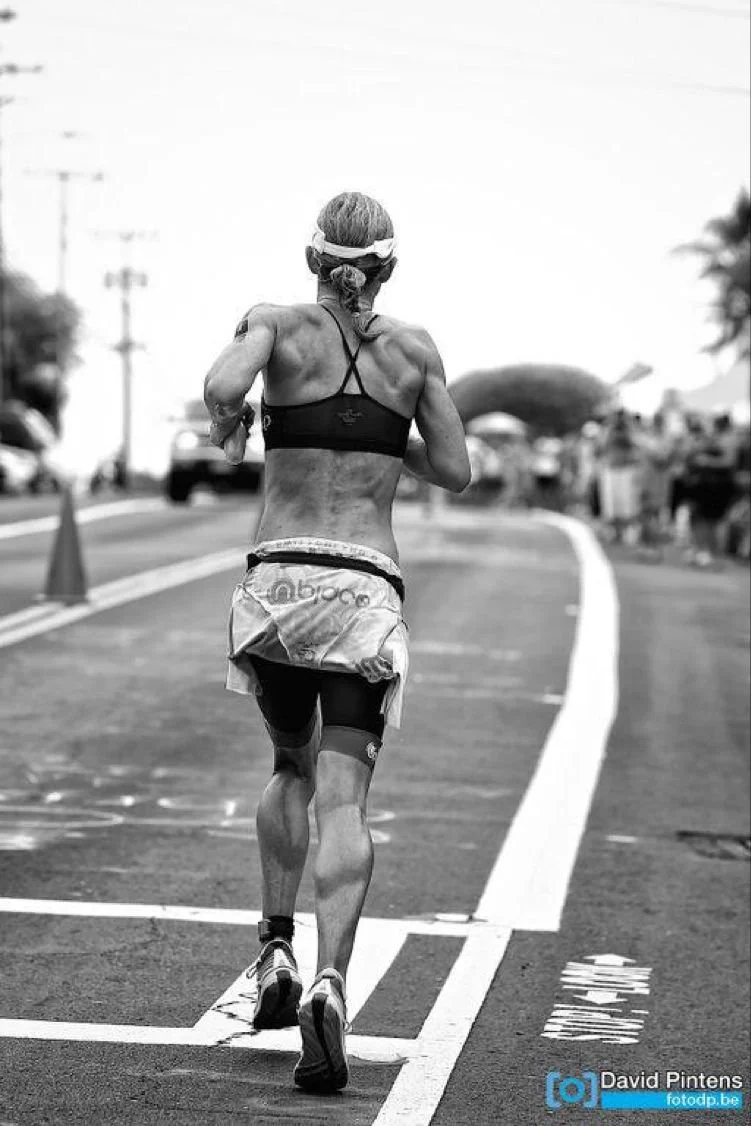
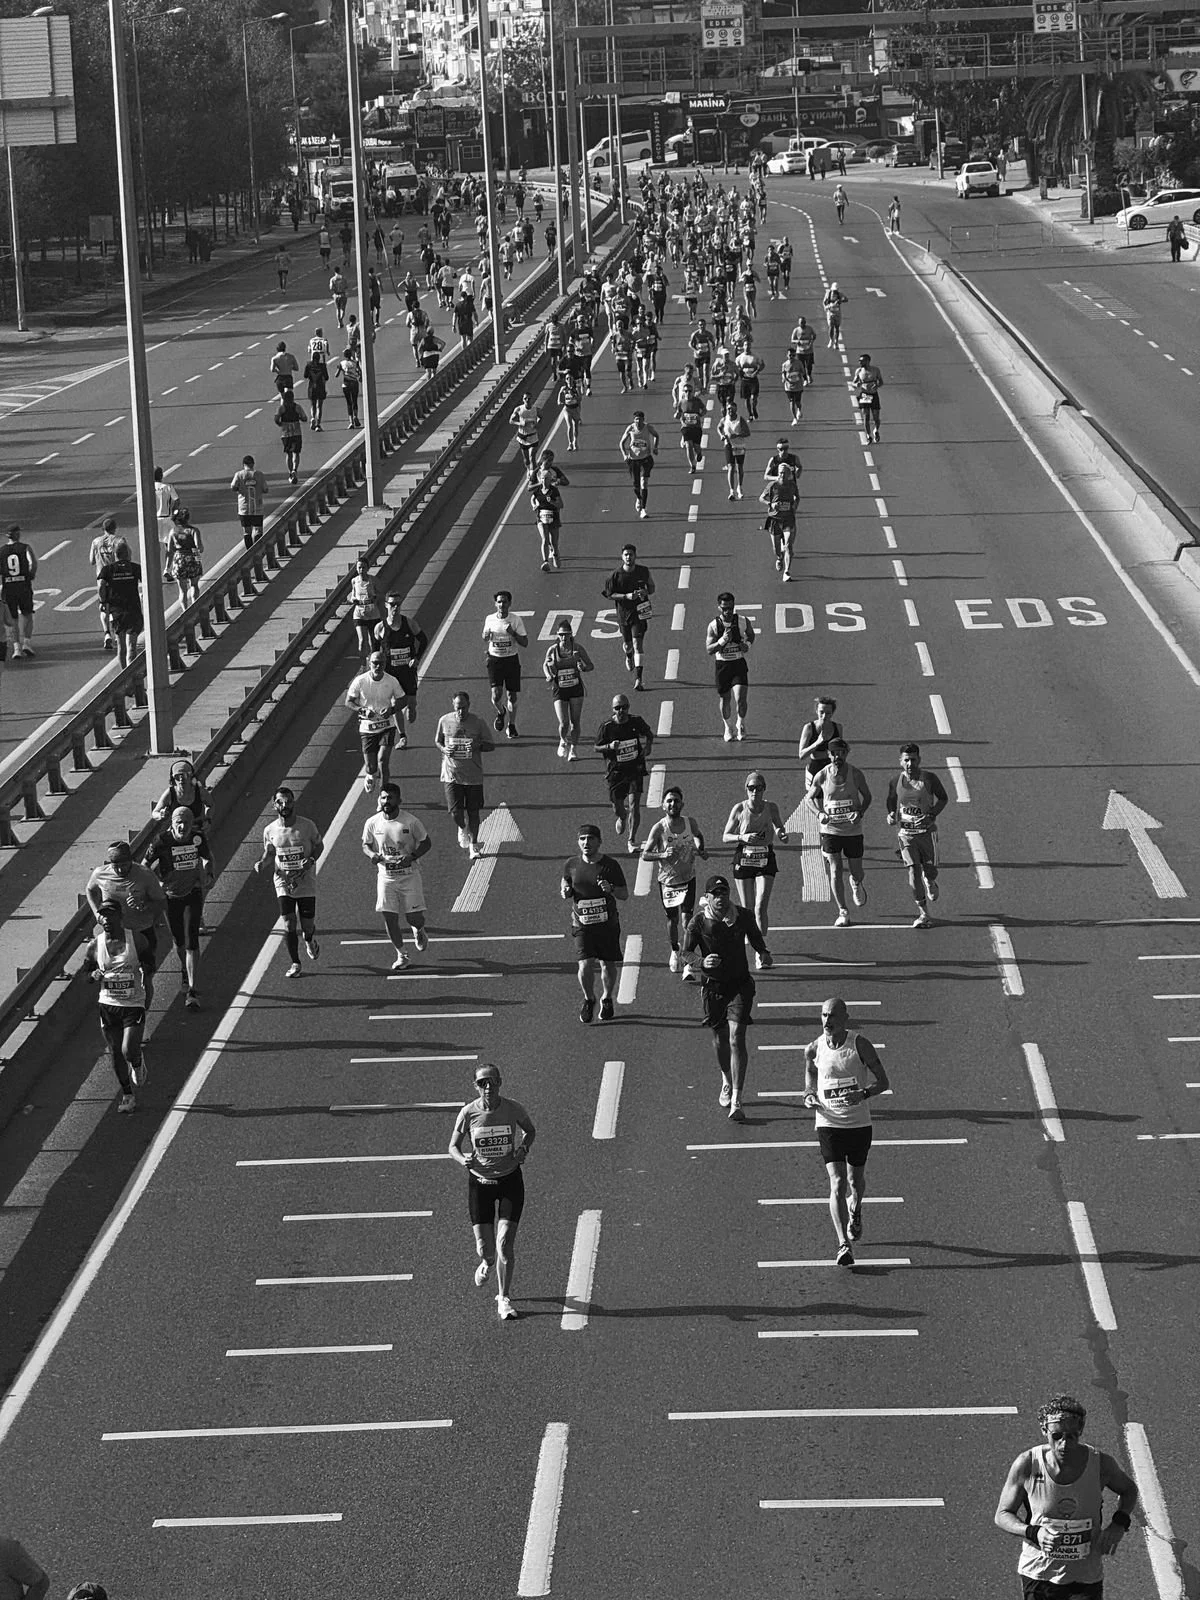
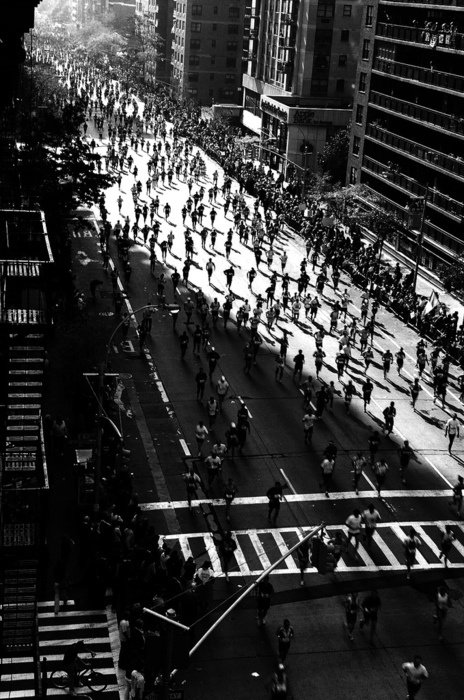
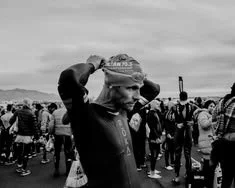
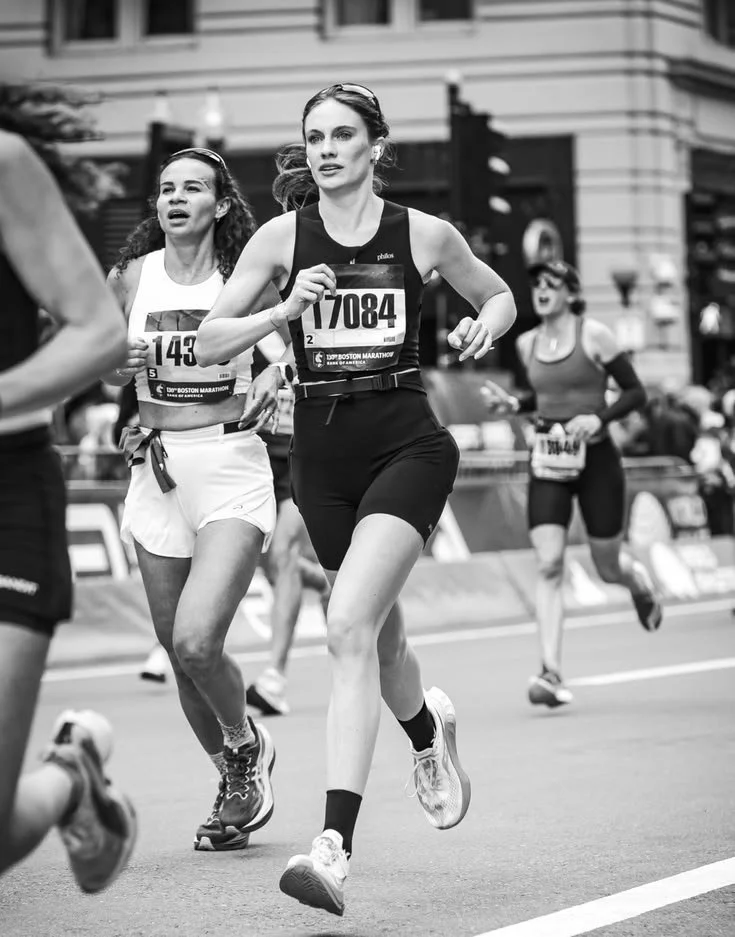
IMAGE GENERATION: Each scene was developed as part of one photographic system rather than as an isolated image. I directed the framing, athlete movement, equipment, lighting and tonal consistency, then refined the generated images through multiple iterations.
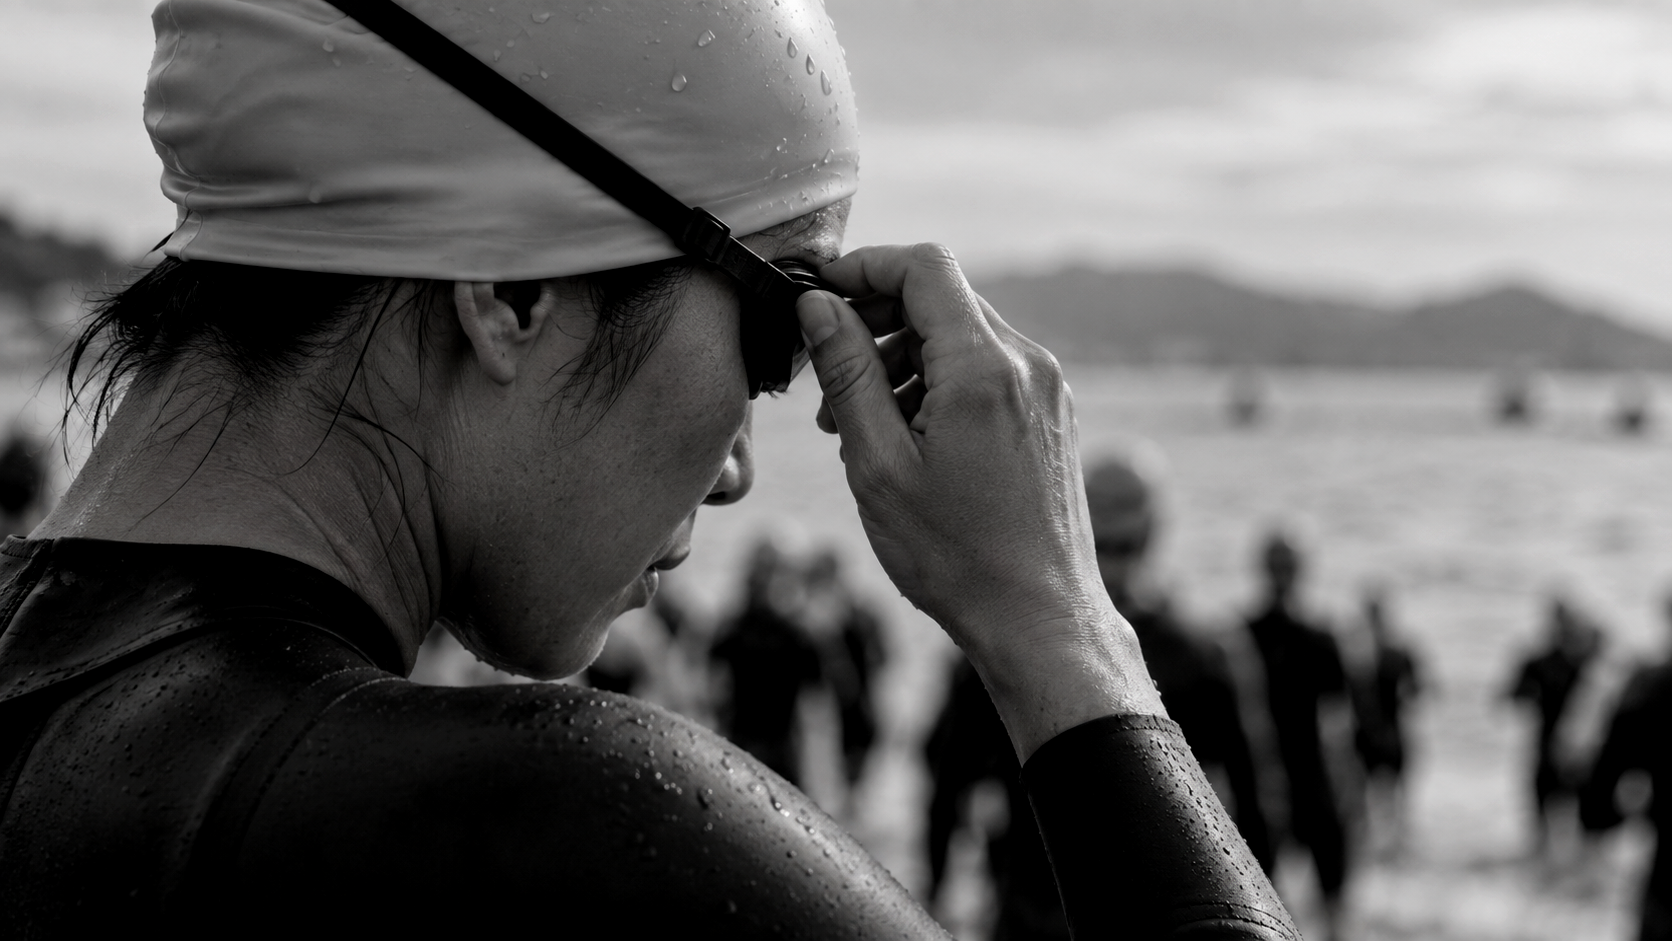
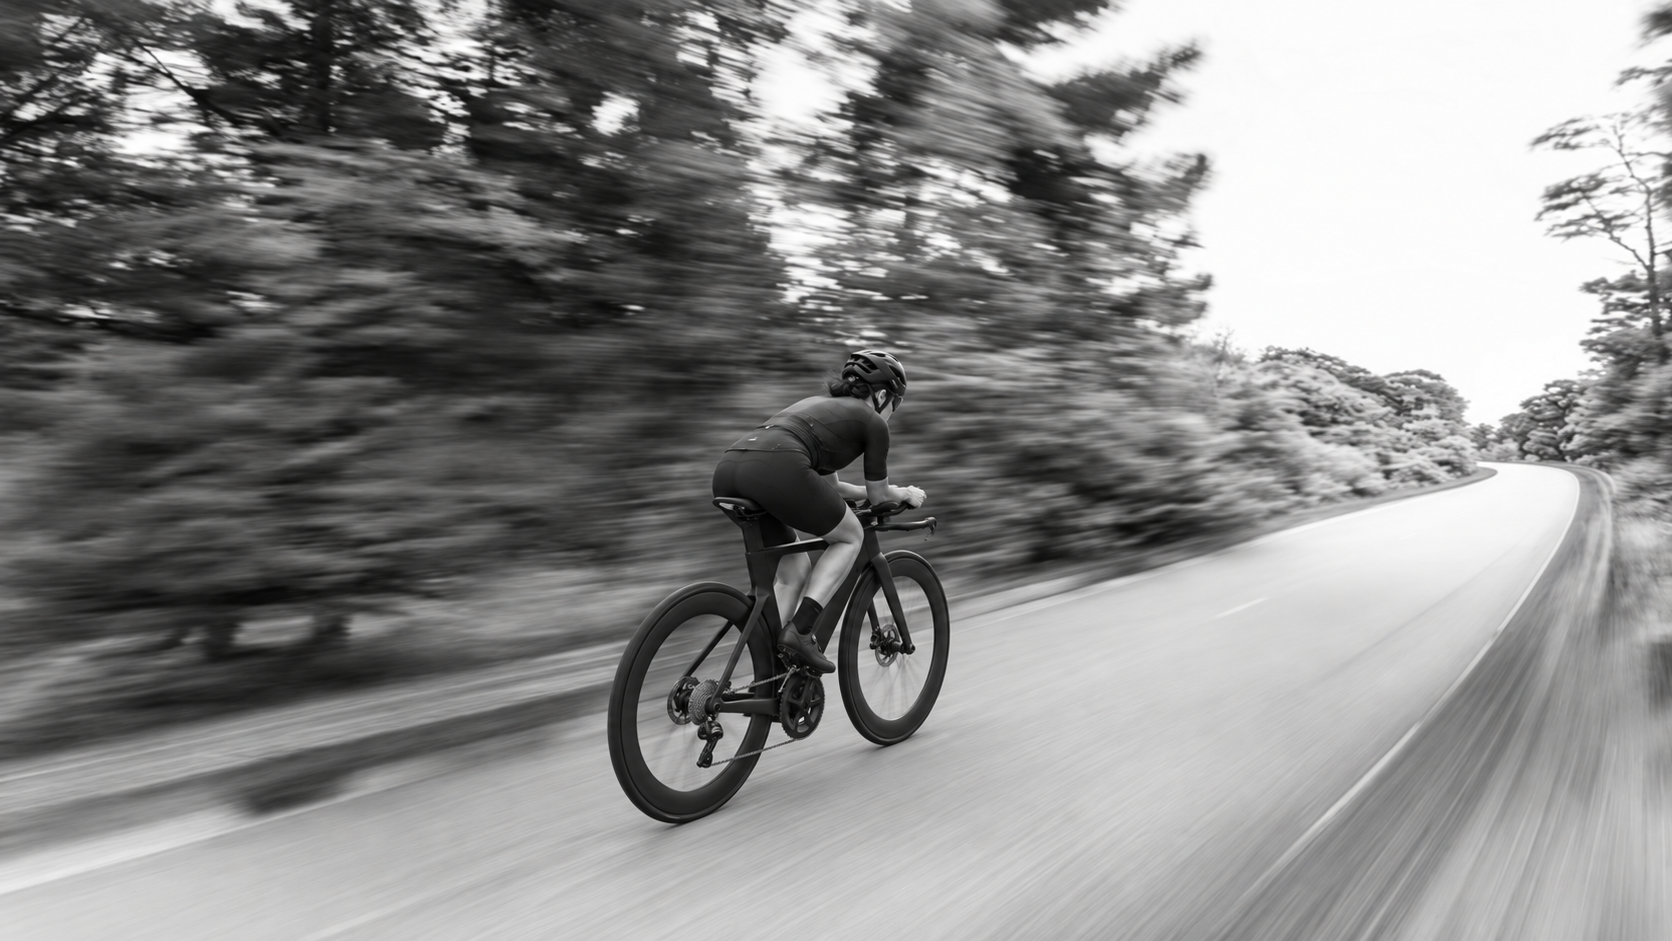
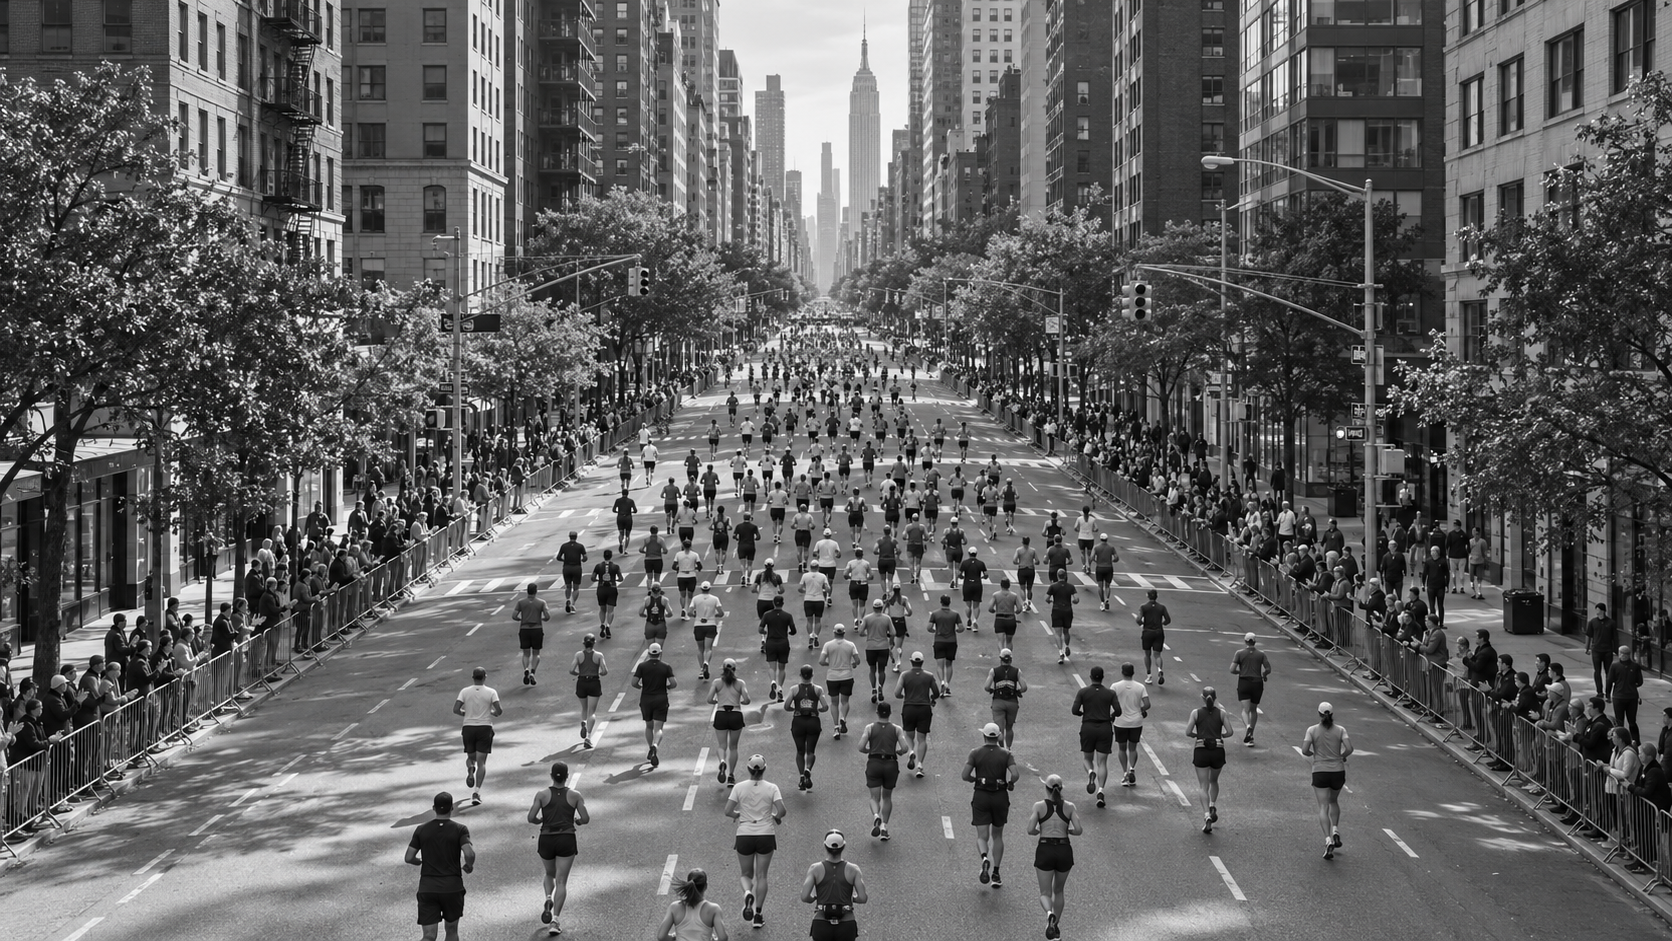
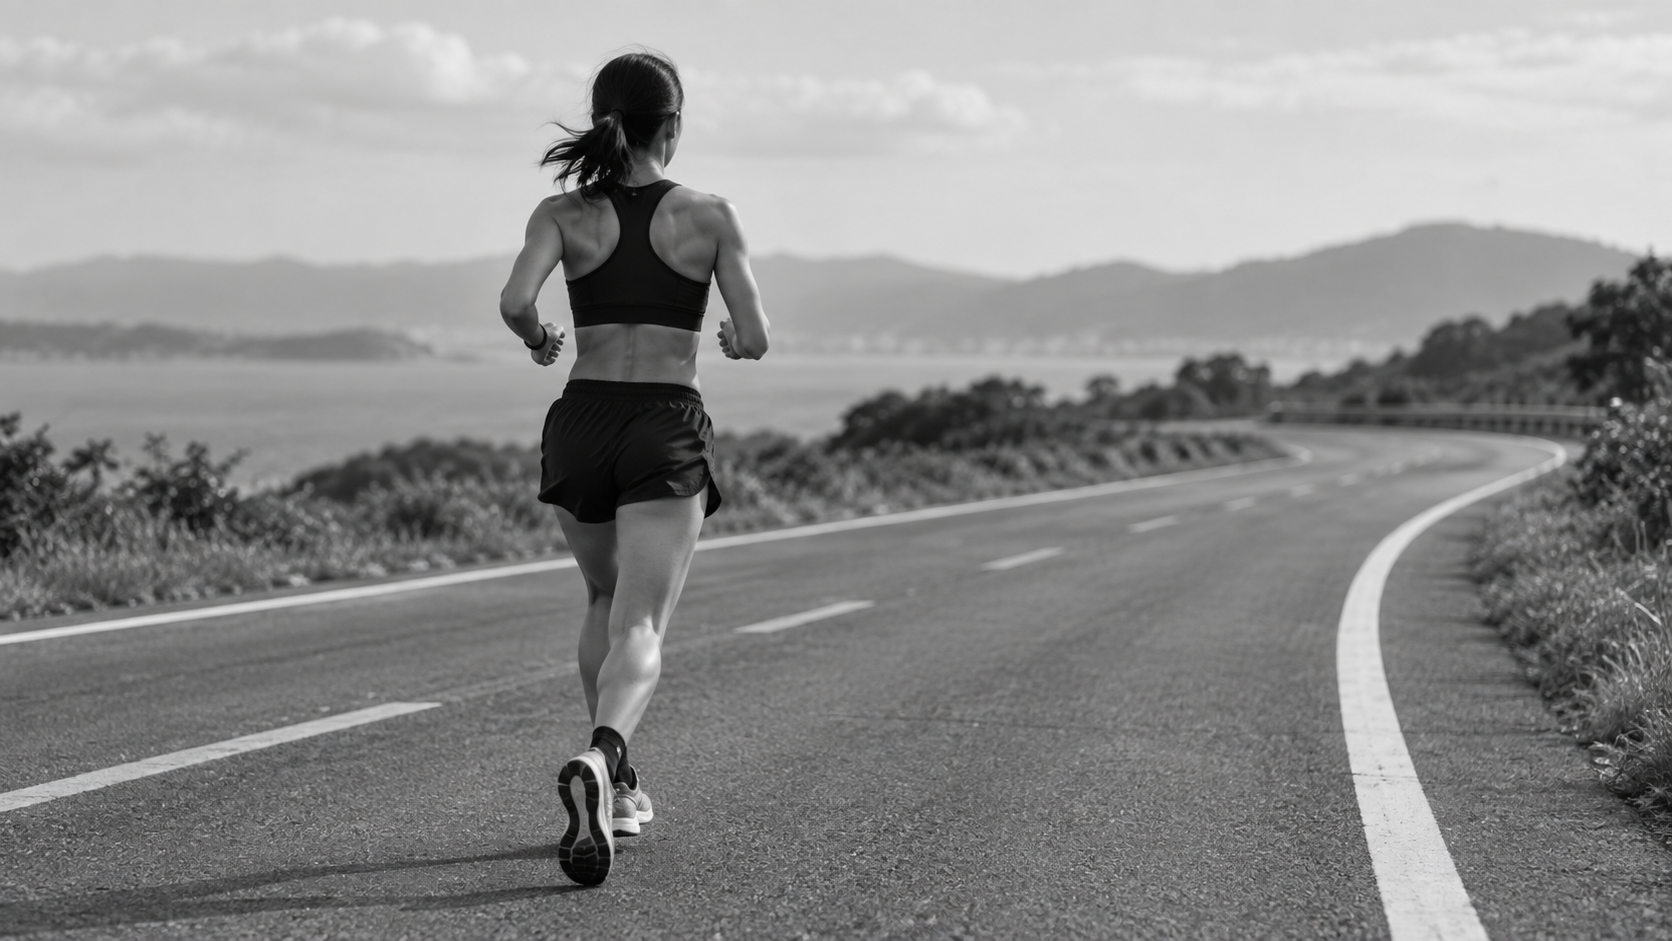
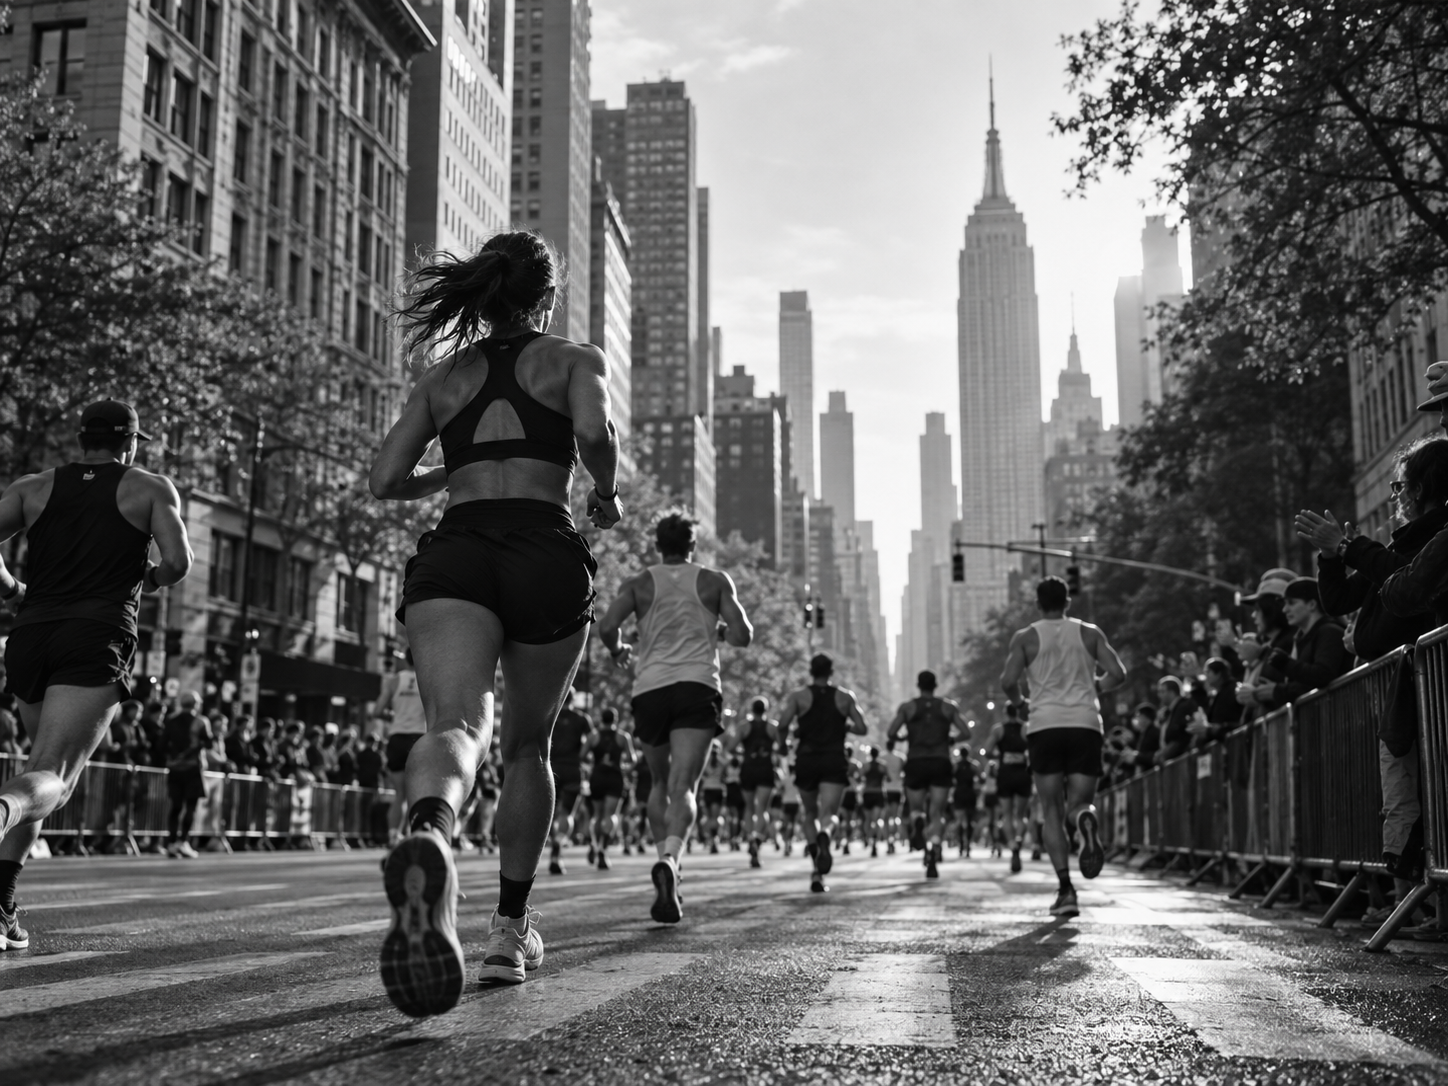
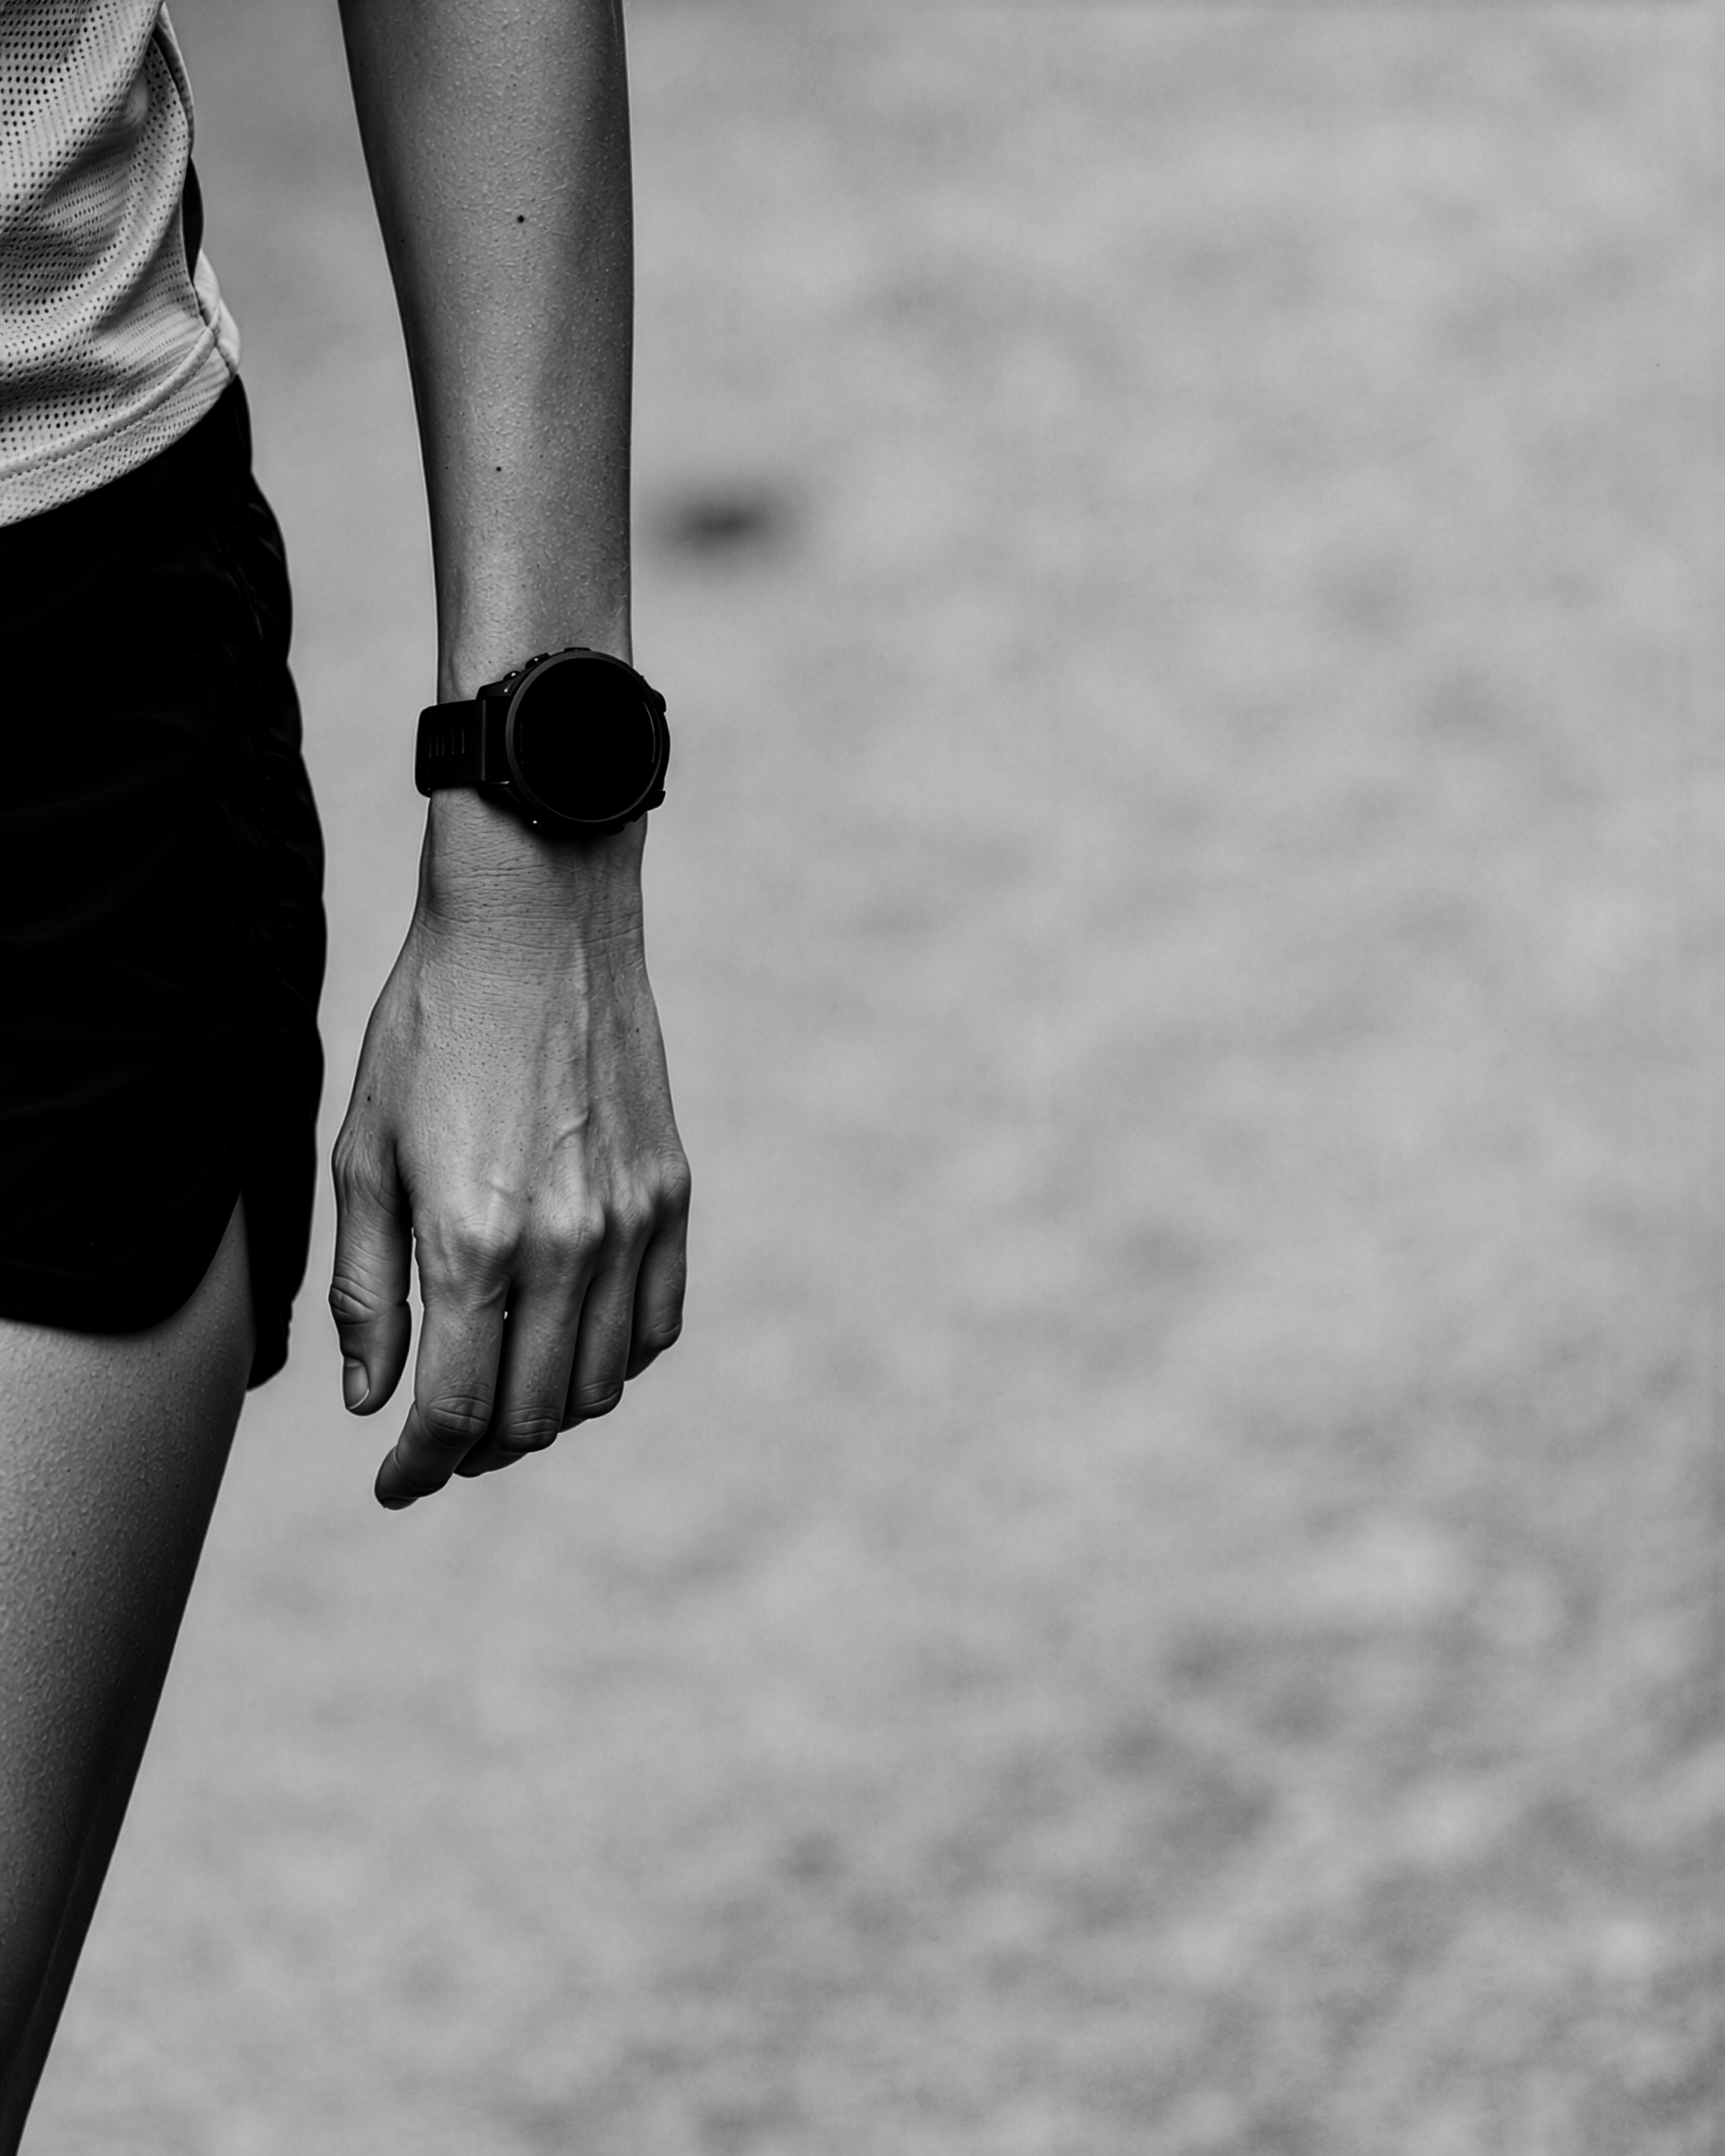
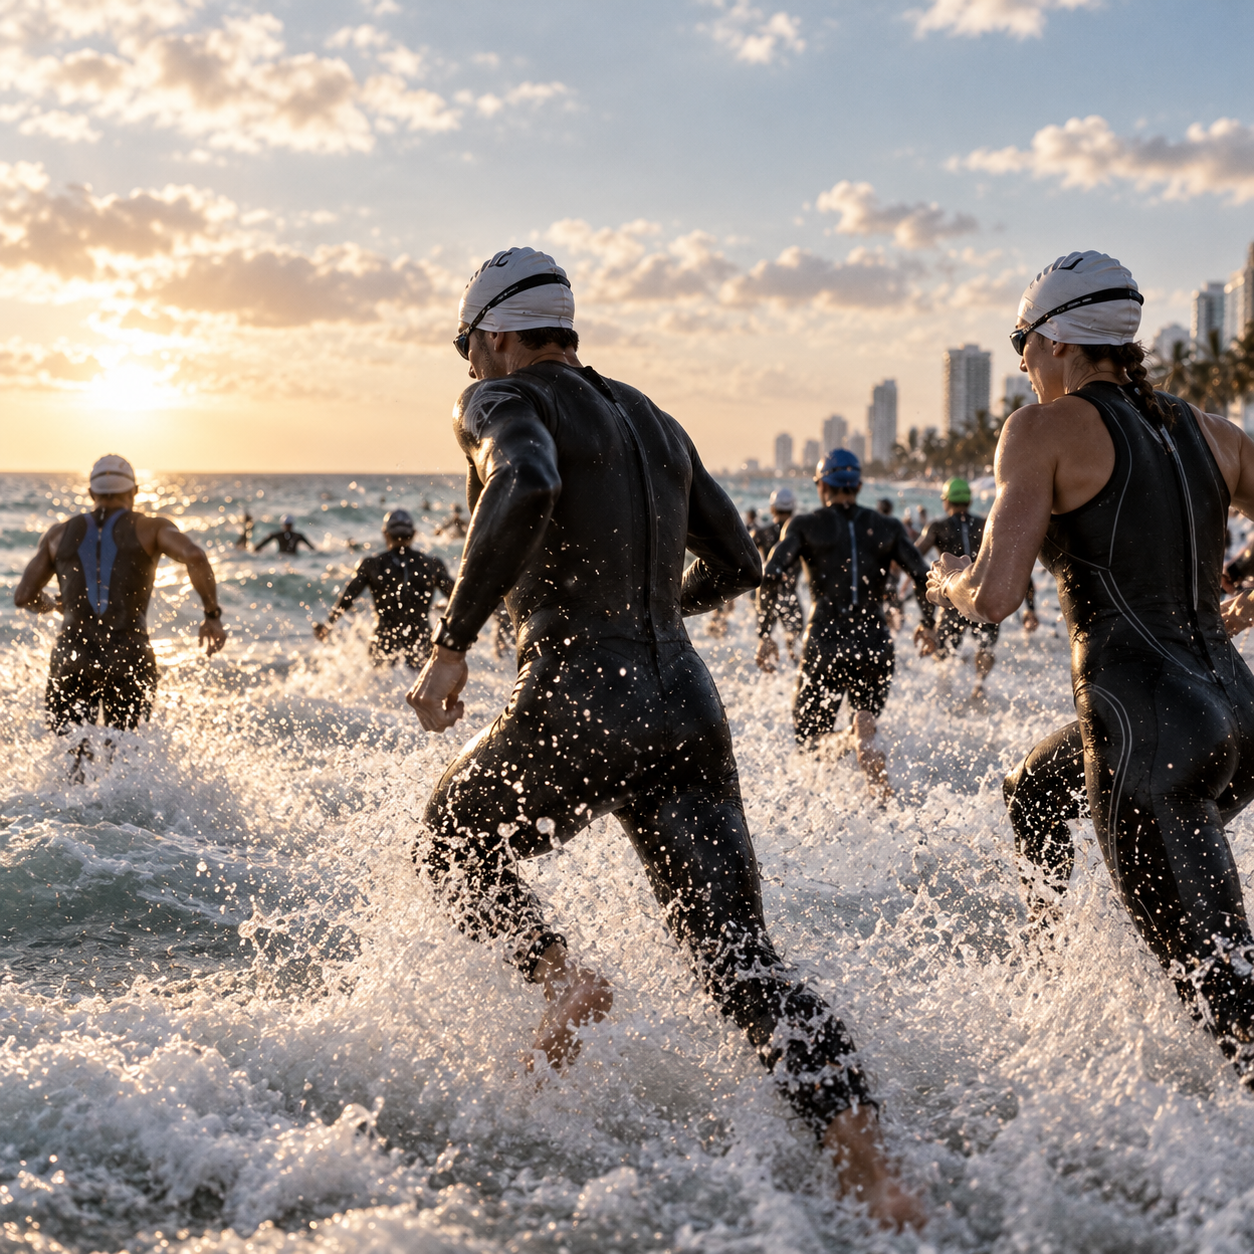
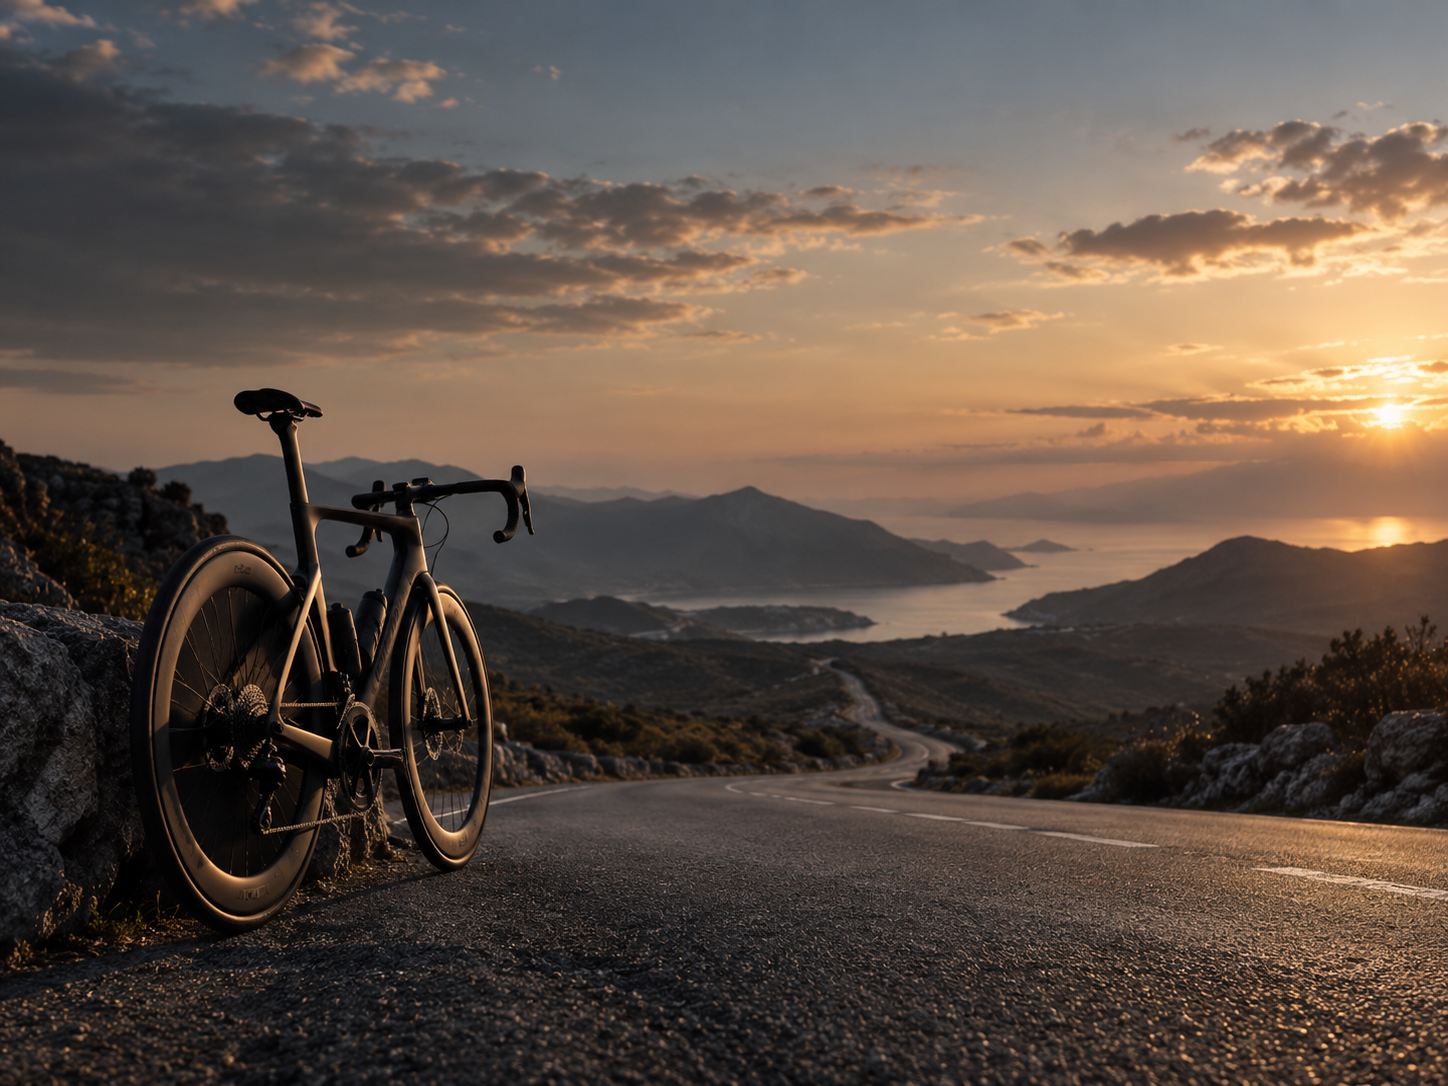
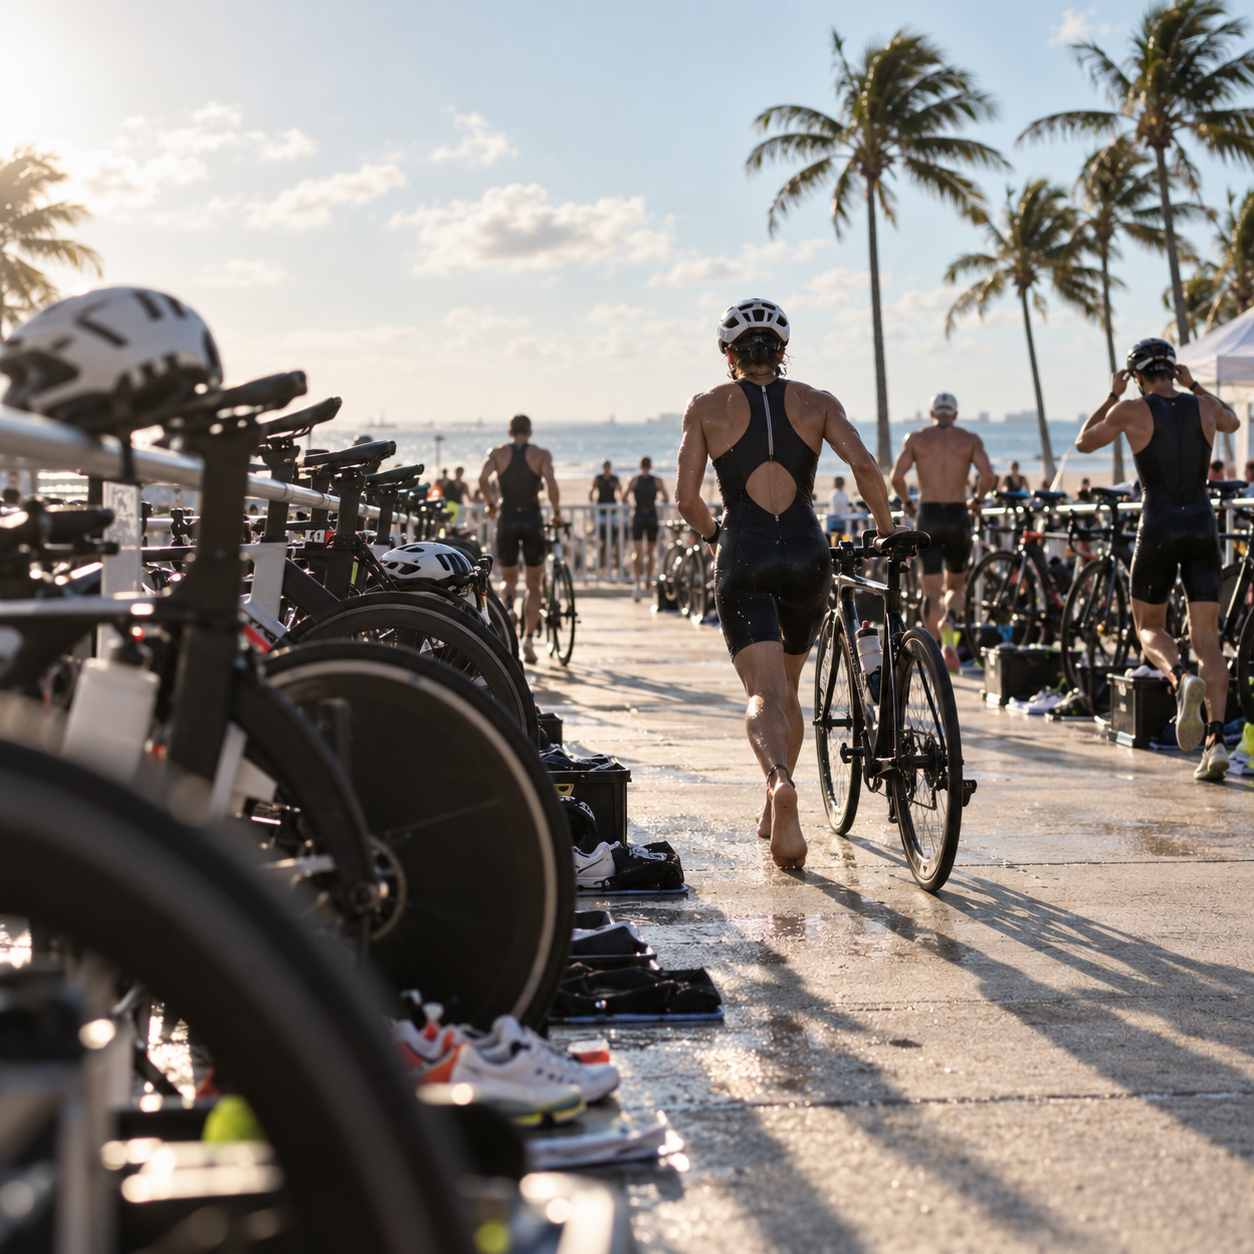
IMAGE TO VIDEO: Selected stills were animated in Kling, with movement directed scene by scene. Camera motion, athlete direction, pacing and crop behavior were adjusted to make the separate clips feel like parts of the same film. The final video was edited, color-graded, and finished in Adobe Premiere Pro.
The site began in Figma Sites. To address publishing and responsive-layout limitations, I moved the build to Squarespace, bringing the interactive charts, imagery, and motion together in a complete web experience.